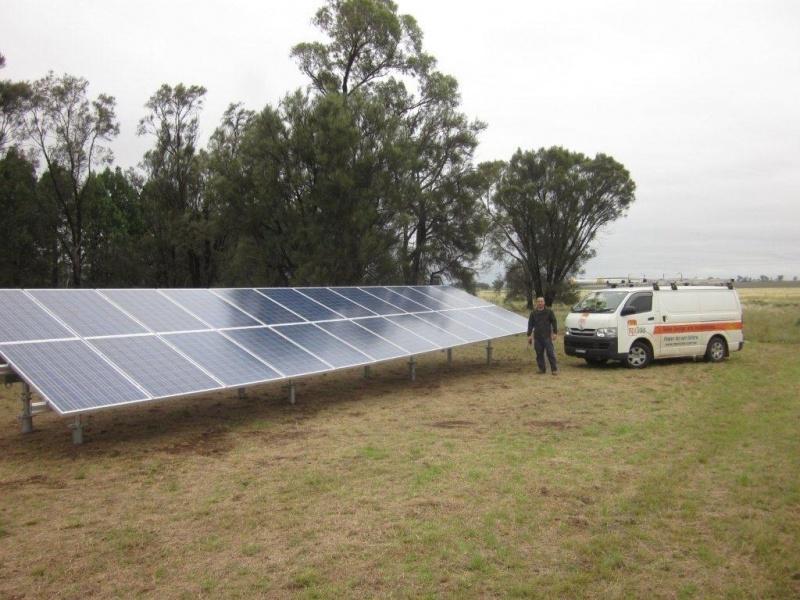
Australia, as just noted yesterday, is experiencing a pretty tremendous solar boom.
Now, here’s some interesting news: it’s the less wealthy who are installing the most solar! That’s counter to the general stereotype that solar is just for the wealthy.
– 2830 Dubbo, NSW – 28.0%2. – 4511 Caloundra QLD – 27.3%
– 5211 Victor Harbor, McCracken, Hindmarsh Valley, SA – 25.9%
– 6208 Pinjarra, Oakley, Ravenswood, WA – 24.7%
– 5214 Currency Creek, Goolwa, Hindmarsh Island, SA – 24.7%
– 5173 Aldinga, Port Willunga, Silver Sands, SA – 24.1%
– 4280 Jimboomba, North & South Maclean, QLD – 23.9%
– 6069 Ellenbrook, Brigadoon, The Vines, WA – 23.8%
– 5158 Hallett Cove, Sheidow Park, SA – 23.6%
– 4208 Ormeau, Jacobs Well, QLD – 23.2%
– 4505 Burpengary, Burpengary East, QLD – 22.2%
– 4507 Bribie Island, QLD – 21.7%
– 2477 Alstonville, Rous, Meerschaum Vale, NSW – 21.2%
– 4165 Victoria Point, Redland Bay, Mt Cotton, QLD – 21.0%
– 4116 Calamvale, Drewvale, QLD – 21.0%
– 5169 Seaford, Moana , SA – 20.7%
– 5095 Mawson Lakes, Pooraka, SA – 20.5%
– 5251 Mount Barker, Bugle Ranges, SA – 20.5%
– 4133 Chambers Flat, Waterford, QLD – 20.2%
– 2486 Banora Point, Tweed Heads South, Bilambil, NSW – 20.0%
As noted previously here on CleanTechnica, over 10% of Australian homes are expected to have solar roofs in the coming months.
Back in April, it was just around 9%. Below were the top post codes in a number of Australian states, as well as some additional comments, all via Australia’s Energy Matters website (courtesy one of our awesome Australian readers):
Western Australia
- – 6208 Pinjarra, Oakley, Blythewood, Ravenswood – 24.7%
- – 6069 Ellenbrook, Brigadoon, The Vines – 23.8%
- – 6155 Canning Vale, Willetton – 19.7%
- – 6065 Ashby, Madeley, Sinagra, Wangara – 19.2%
- – 6233 Australind, Binningup, Leschenault, Parkfield – 18.7%
- – 6210 Dawesville, Falcon, Halls Head, Wannanup – 18.0%
- – 6164 Atwell, Banjup, Hammond Park, Yangebup – 17.0%
- – 6280 Ambergate, Busselton, Jindong, Kaloorup – 15.7%
- – 6109 Maddington, Orange Grove – 15.7%
- – 6111 Canning Mills, Champion Lakes, Karragullen – 15.7%
There weree nearly 83,000 solar installations in Western Australia by the end of 2011.
Queensland
- – 4551 Caloundra, Pelican Waters, Golden Beach – 27.3%
- – 4280 Jimboomba, North Maclean, South Maclean – 23.9%
- – 4208 Ormeau, Jacobs Well – 23.2%
- – 4505 Burpengary, Burpengary East – 2.2%
- – 4507 Bribie Island – 21.7%
- – 4165 Victoria Point, Mount Cotton, Redland Bay – 21.0%
- – 4116 Calamvale, Drewvale, Stretton – 21.0%
- – 4133 Chambers Flat, Waterford – 20.2%
- – 4124 Greenbank, Boronia Heights, Spring Mountain – 19.7%
- – 4520 Samford Valley, Mount Glorious, Mount Nebo – 19.5%
At the end of 2011, over 158,000 Queensland households had installed solar power systems.
South Australia
- – 5211 Victor Harbor, McCracken, Hindmarsh Valley – 25.9%
- – 5214 Currency Creek, Goolwa, Hindmarsh Island – 24.7%
- – 5173 Aldinga Beach, Port Willunga, Silver Sands – 24.1%
- – 5158 Hallett Cove, Sheidow Park – 23.6%
- – 5169 Seaford, Moana – 20.7%
- – 5095 Mawson Lakes, Pooraka – 20.5%
- – 5251 Mount Barker, Bugle Ranges – 20.5%
- – 5098 Ingle Farm, Walkley Heights – 19.6%
- – 5161 Reynella, Reynella East, Old Reynella – 18.7%
- – 5118 Gawler, Evanston – 18.7%
The state came in third nationally with 55,592 solar power systems in South Australia installed to the end of 2011.
New South Wales
- – 2830 Dubbo and surrounds – 28.0%
- – 2477 Alstonville, Rous, Meerschaum Vale – 21.2%
- – 2486 Banora Point, Tweed Heads South, Bilambil – 20.0%
- – 2400 Moree, Taloona – 19.4%
- – 2880 Broken Hill, Silverton – 19.2%
- – 2147 Seven Hills, Lalor Park – 18.2%
- – 2478 Ballina, Lennox Head – 17.3%
- – 2483 Brunswick Heads, Ocean Shores, Billinudgel – 16.6%
- – 2550 Bega, Candelo, Kanoona, Wolumia – 16.6%
Over 8.5 per cent of NSW househoulds have gone solar; just behind the national average . The CEC says Dubbo is now Australia’s solar power capital.
Victoria
- – 3564 Echuca – 13.3%
- – 3690 Wodonga – 13.2%
- – 3551 Emu Creek, Axe Creek, Myrtle Creek – 13.2%
- – 3818 Drouin, Jindivick – 12.9%
- – 3023 Caroline Springs, Deer Park, Burnside – 11.6%
- – 3029 Hoppers Crossing, Tarneit, Truganina – 11.6%
- – 3024 Wyndham Vale, Mambourin, Mount Cottrell – 11.3%
- – 3037 Calder Park, Sydenham – 10.9%
- – 3076 Epping – 10.2%
- – 3173 Keysborough – 9.8%
Solar power in Victoria lags behind other states, with the top Victorian solar postcode 121st on the national list. Around 5.7 per cent of houses in Victoria have solar panels installed.
Ranking details for Tasmania, the ACT and Northern Territory were not provided.
Commenting on the report, Clean Energy Council acting Chief Executive Kane Thornton said:
“With the price of panels now about a third of what they were was just three years ago, many people see solar power as a way to save on their energy bills as well as do something for the environment.”
“We now have more than half a million solar power systems in Australia, but really we are just in the early stages of tapping in to the power of this technology. Solar panels are fast becoming the Hills Hoist of the 21st Century.” [Editor’s Note: the number of rooftops seems to be about 750,000 now.]
By Clean Technica


