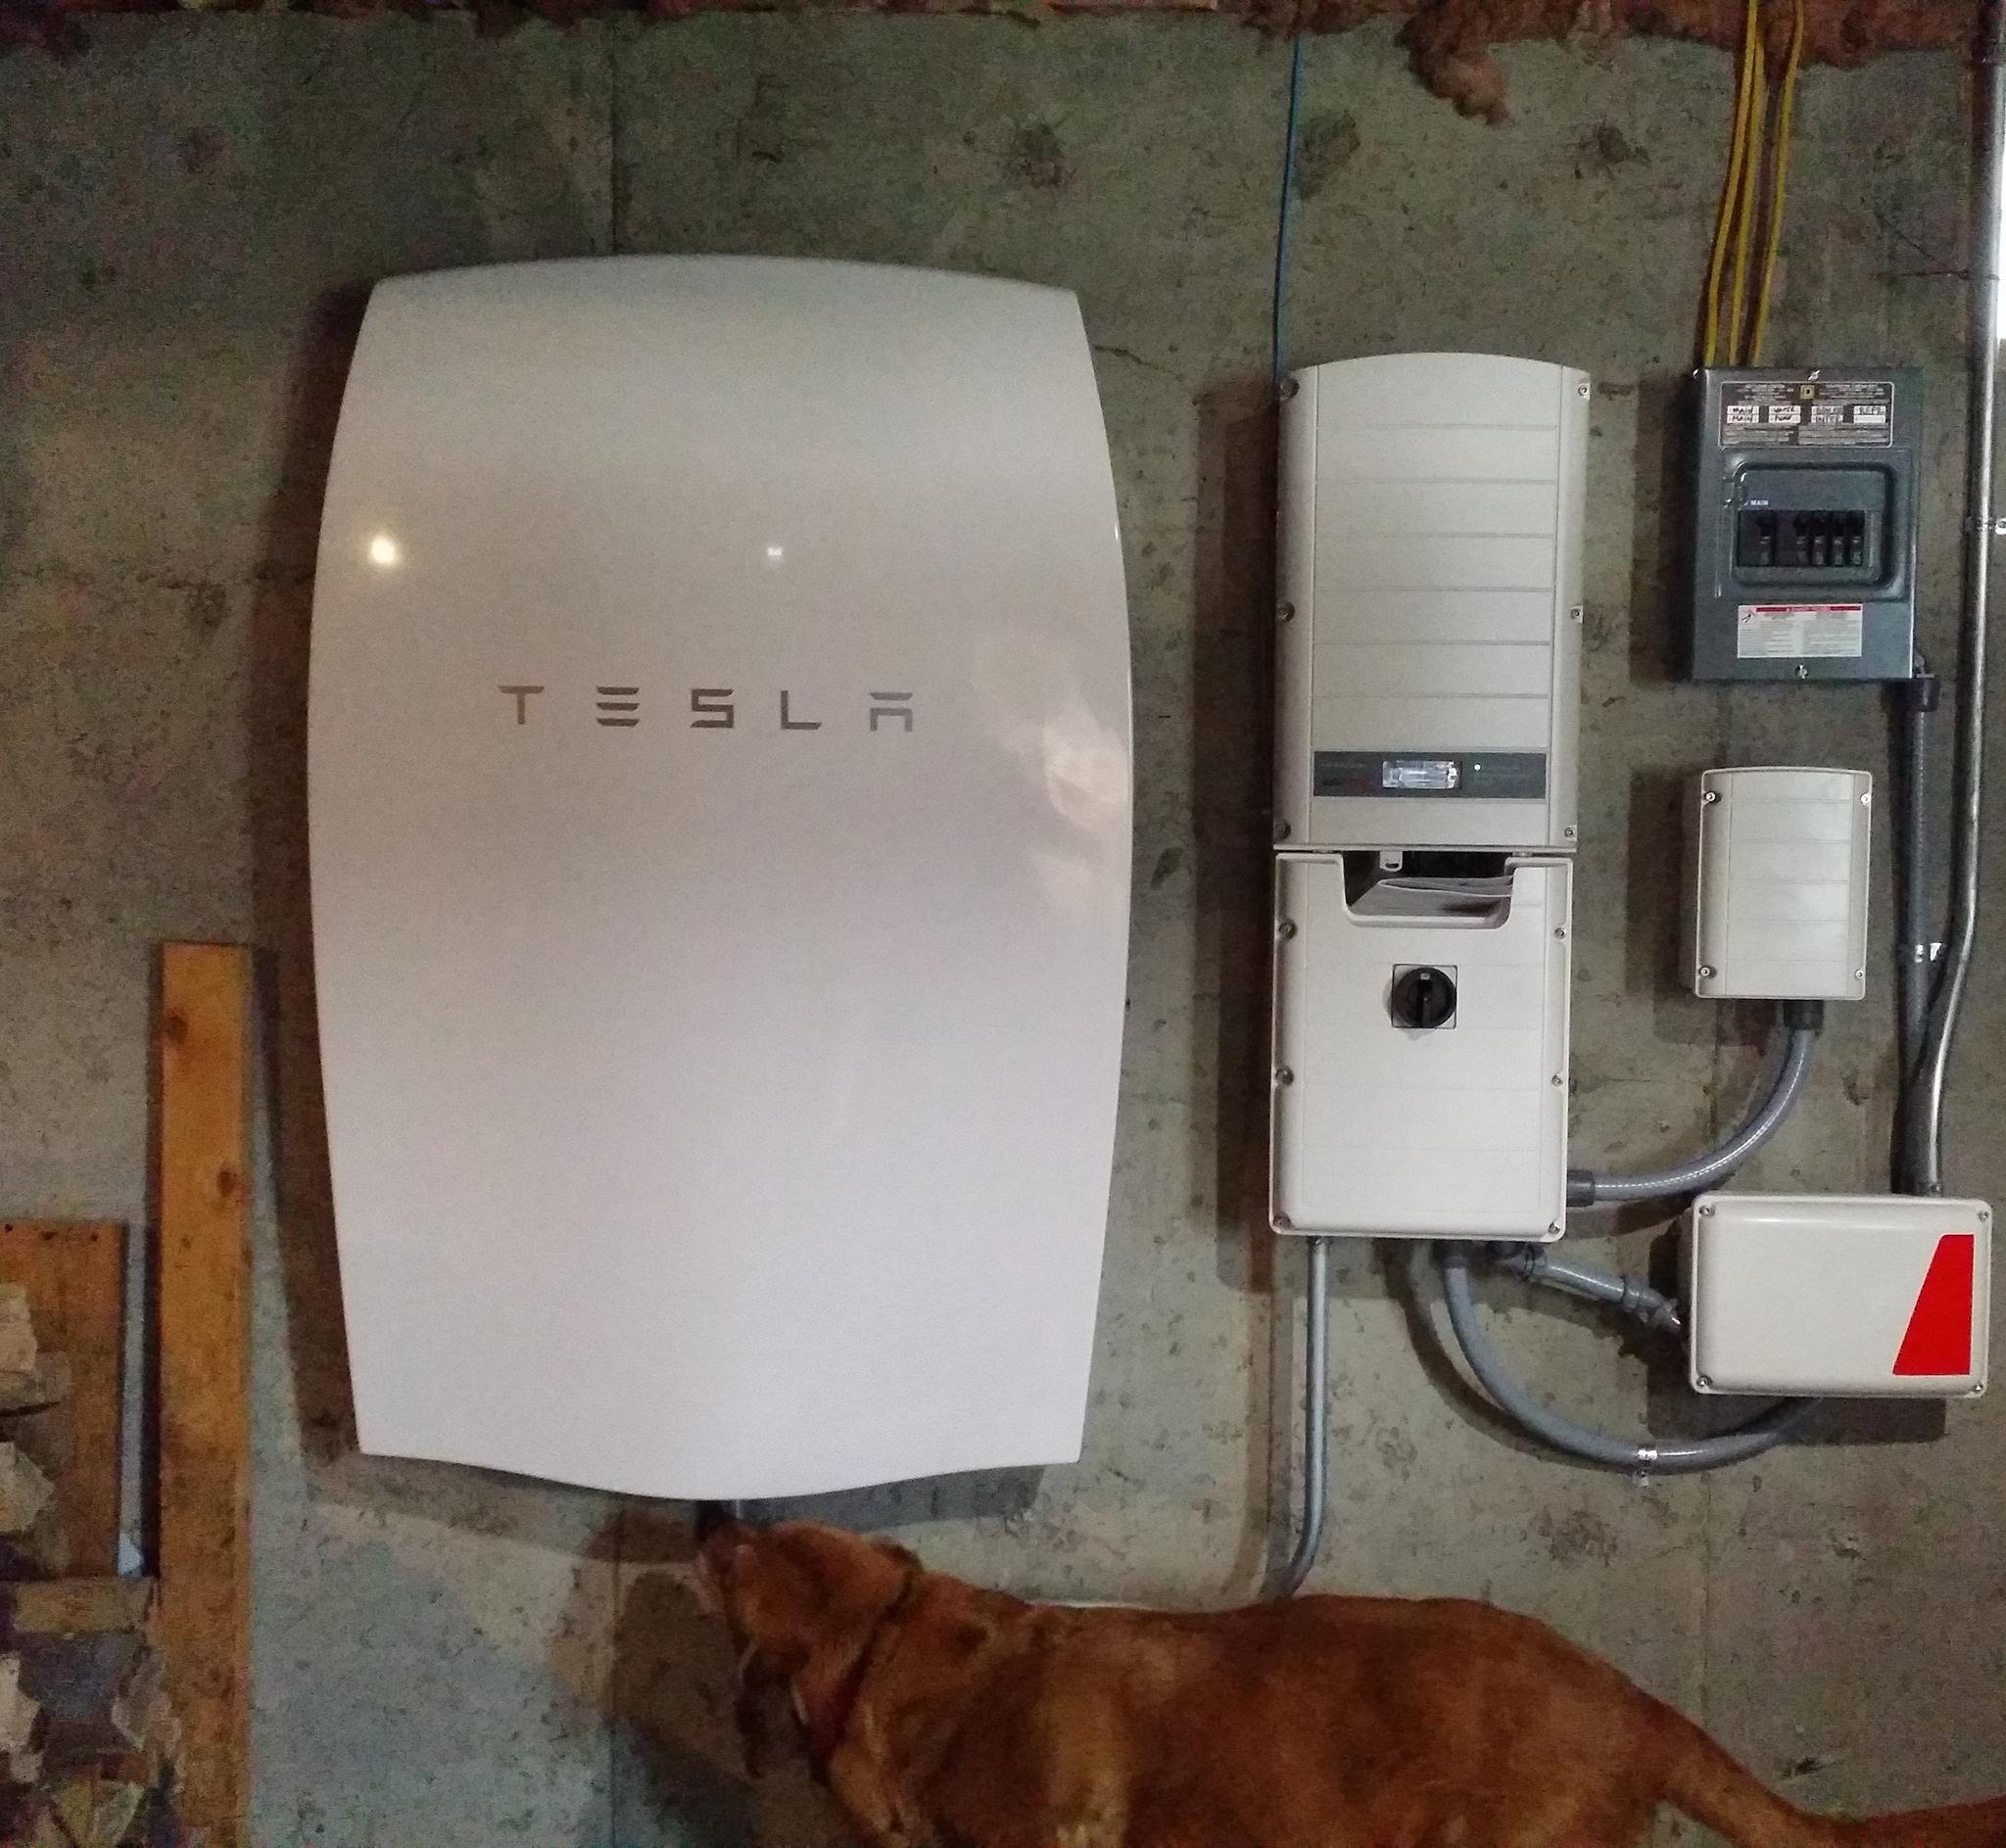
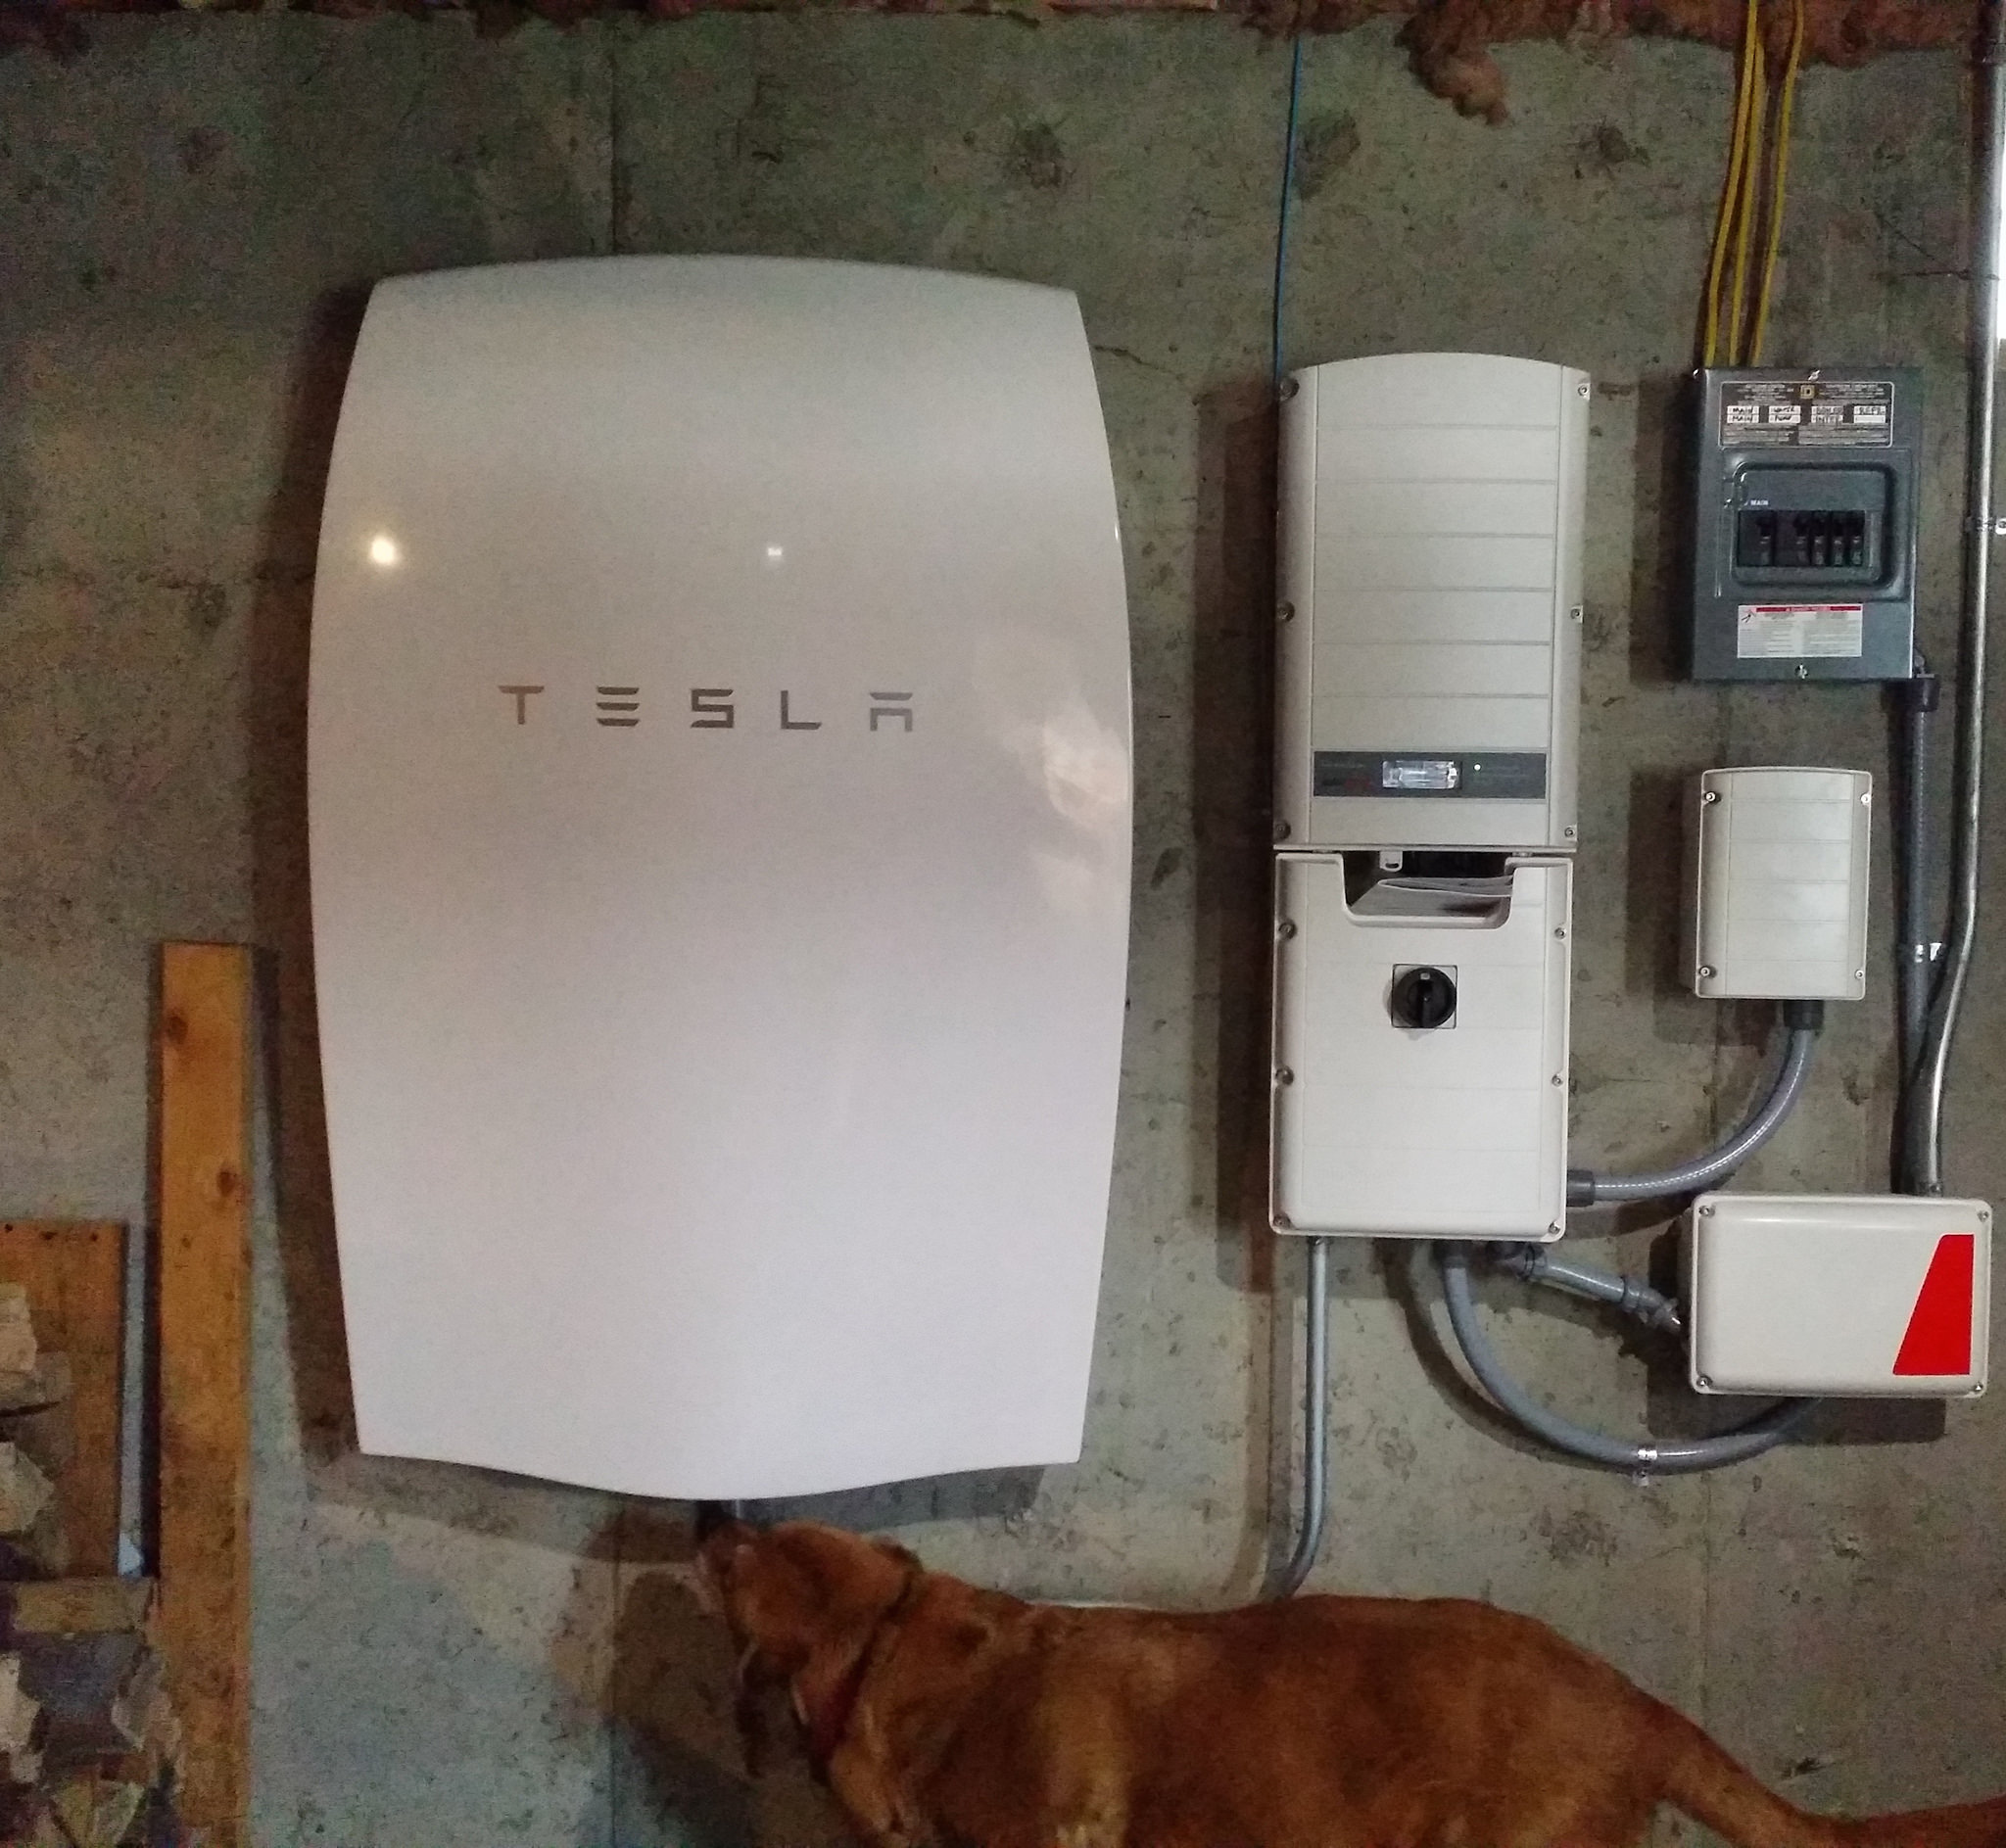
Finally, we have the real-world usage figures that combine the market impact of the Tesla Powerwall and solar panel systems. Based on the figures received from Natural Solar, our calculation of Tesla’s Powerwall plus solar panels payback is approximately double what was previously reported 13 years ago; this is while use of solar, without the Powerwall accounts for a huge chunk of the savings on your power bill.
If the system’s purchase price could have accrued or earned interest like a mortgage, then the simple payback could increase to 20 years or more.
Obviously this is not a one size fits all scenario, otherwise, electricity costs and other usage patterns would make the payback time even shorter.
But, it’s worth noting that ROI is not the only metric in the equation and that solar and battery storage installation have other benefits. As one of the early adopters, the Pfitzner family has been driving forward advancement in technology and moves us a step closer to the smart, fault tolerant and distributed mesh of electricity generation and storage for all.
Setting up the Powerwall (and related monitoring and management tech) means a household can easily track and optimise their electricity usage to save money and also have access to programs like the GridCredits. The system will also provide a cushion against the ever rising power costs as well as additional benefits from time of day billings.
Numbers and Assumptions
We’ve sourced all our facts and figures directly from Natural Solar. Consider these calculations as a basis for the finer intricacies used to calculate returns for more specific circumstances. Only the Powerwall efficiency losses have been included. The figures cover the billing period only; ideally we’ll need an entire year’s worth of data to make more accurate calculations, especially when it comes to solar power generation.
Powerwall numbers have been generated from data provided by Tesla. While we’ve done the best we can to be as accurate as possible, we invite any discussion or opinions on the figures.
The Facts And Figures
In Tesla’s scenario, a family operates with a $50.39 bill over a billing period of 86 days. They utilized $47.21 worth of power, received $58.88 worth of credit under the solar feed-in tariff and paid $52.13 for metering and related charges. There’s also a $9.93 charge for GST.
The household is connected with Diamond Energy which normally charges $0.215 per kWh and offers a $0.08 per kWh solar feed-in tariff. The complete system will consist of Powerwall, a 5 kW solar array and related inverter and monitoring gears. Natural Solar sells the kit at $14,990, including an upfront government rebate.
During the billing period, the household averaged about 21 kWh per day of solar generation. This is clearly above the average annual figures from Solar Choice, of about 19.5 kWh. In this case, a full year’s worth of data might be required to get a more accurate figure.
Day by Day in kWh
On an average day throughout the billing period, the solar system outputs about 21 kWh from the solar inverter. Approximately 6.64 kWh is then used to power the Powerwall. An additional 5.8 kWh is then utilized to power appliances such as washing machines, pool pumps, dishwashers etc. directly from solar at daytime. About 8.56 kWh is then exported back to the grid for a credit.
Once the sun sets, about 6.16 kWh is produced by the Powerwall to run the household applications (based on Telsa Powerwall efficiency numbers). The house also draws an additional average of 2.55 kWh from the grid daily whenever the Powerwall runs out of juice.
The house utilizes an average of 14.5 kWh each day of which 5.8 kWh is from solar, 6.16 kWh from the Powerwall, while 2.55 kWh is from the grid. About 0.5 kWh is lost during transmission in and out of the Powerwall. This is certainly an incredible result, and excellent direct use of the solar system.
Savings Comparisons
Based on the overall kWh usage, an Australian household would pay about $350 for the same bill, with no solar system or Powerwall setup. As you can see, this difference is huge compared to the $660 bill applied in the Natural Solar comparison.
Essentially, the Solar + Powerwall system will save about $300 on the bill ($1375 a year). The payback time period in this case for the entire system is 12 years. This is reasonable, but outside the Powerwall’s 10 year warranty.
The Rising Electricity Costs
If in the future, power will cost more per kWh – therefore, the Powerwall + solar system can save even more over time and eventually lower the simple payback time. Obviously, there have been great debates over the projected long-term power prices despite the short term gains.
The Climate Institute recently crunched some numbers and recommended that electricity prices in Australia are currently almost the same as they were some 25 years ago, after factoring in the inflation. Nevertheless, more price hikes are expected in the near future.
Switching to daytime charging could also help save money, and that’s the main future plan for existing solar and Powerwall setup. This is likely to drop the simple payback to about 10 years.
Other Factors
While existing solar systems can’t protect against blackouts, in future the Powerwall will. It’s also a bold step towards clean energy use, and can help slash the prices for anyone else.
Even though solar consumers could invest elsewhere, solar and a Powerwall is the ideal technology combination, and definitely the way of the future.
Photo courtesy of Bryan Alexander


